Can Carbon Footprint Information Influence Consumer Choice?

Climate change, environmental degradation, looming resource conflicts –
the pressure to act is increasing. On the path towards an ecologically
sustainable economy and society, we consumers play a central role. Better
information has the potential to encourage us to consume more sustainably
and thus positively impact the economy, the environment and society. But
can mere information really have a tangible impact on our decisions? Does
information about the CO2 footprint of food entice us to eat more
sustainably? And how does this information need to be presented in order
to influence our food choices? We found out in a field experiment.
Continue reading for the results.
Results:
Participants change their consumption behavior when confronted with the carbon footprint of their food
We found out: Providing information about the carbon footprint of a dish affects the participants’ food-choices. Also, how exactly this information is presented plays a role: participants react stronger to CO2-information that is color-coded in traffic light colors, and information put into a monetary context has a greater effect than mere numeric information. Here are our three main results in detail:

Main result 1
According to participants’ self-assessment, the ecological footprint plays only a minor role in their choice of food – relative to more important criteria such as appearance and taste.
Main result 2
Nevertheless, labeling with emissions data reduces the demand for CO2-intensive dishes such as meat and fish – and thus the overall carbon footprint of the chosen food.

Main result 3
This effect is particularly pronounced when CO2 data are visualized in traffic light colors or presented as “environmental costs” (in Euros per 100 g).
Main result 1
Participants’ self-assessment: ecological footprint plays
only a minor role in their choice of food
What criteria do you usually apply to select your dishes at the canteen?
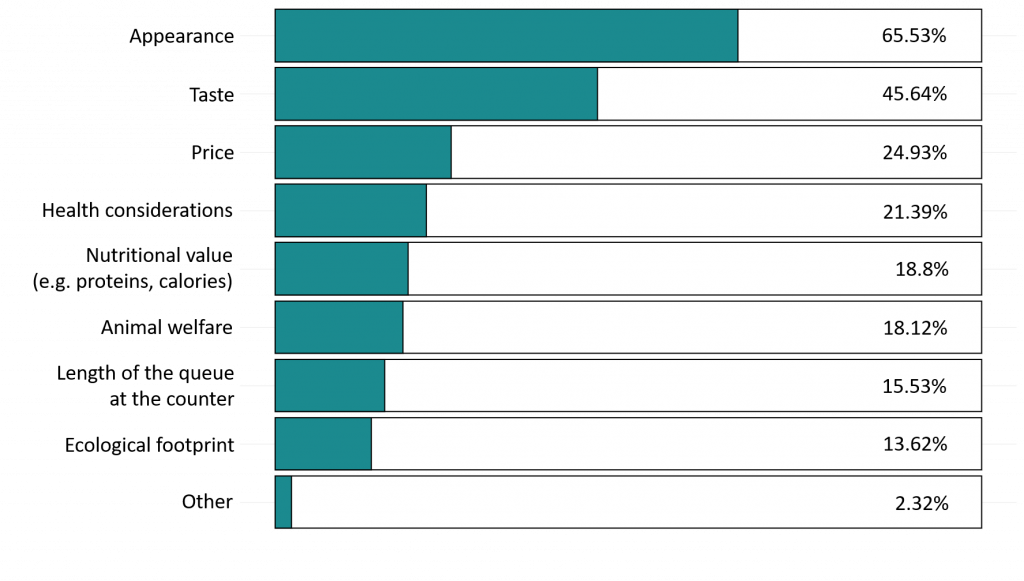
This graph reports responses to the online survey that accompanied our experiment. It is based on 2,975 individual criteria applied for meal selection by 734 participants. It was possible to skip this question. Participants were allowed to respond once daily. For this graph, we only used the first response provided by any one participant during the experimental period. Survey participation was voluntary and anonymous.
How happy are you with your meal today?

This graph reports responses to the online survey that accompanied our experiment. It is based on 1,649 answers from 824 different participants. Participants were allowed to respond once daily. It was not possible to skip the question above. Survey participation was voluntary and anonymous.
Main Result 2 & 3
Carbon footprint labels reduce the climate impact of the chosen dishes – but it’s the presentation that counts

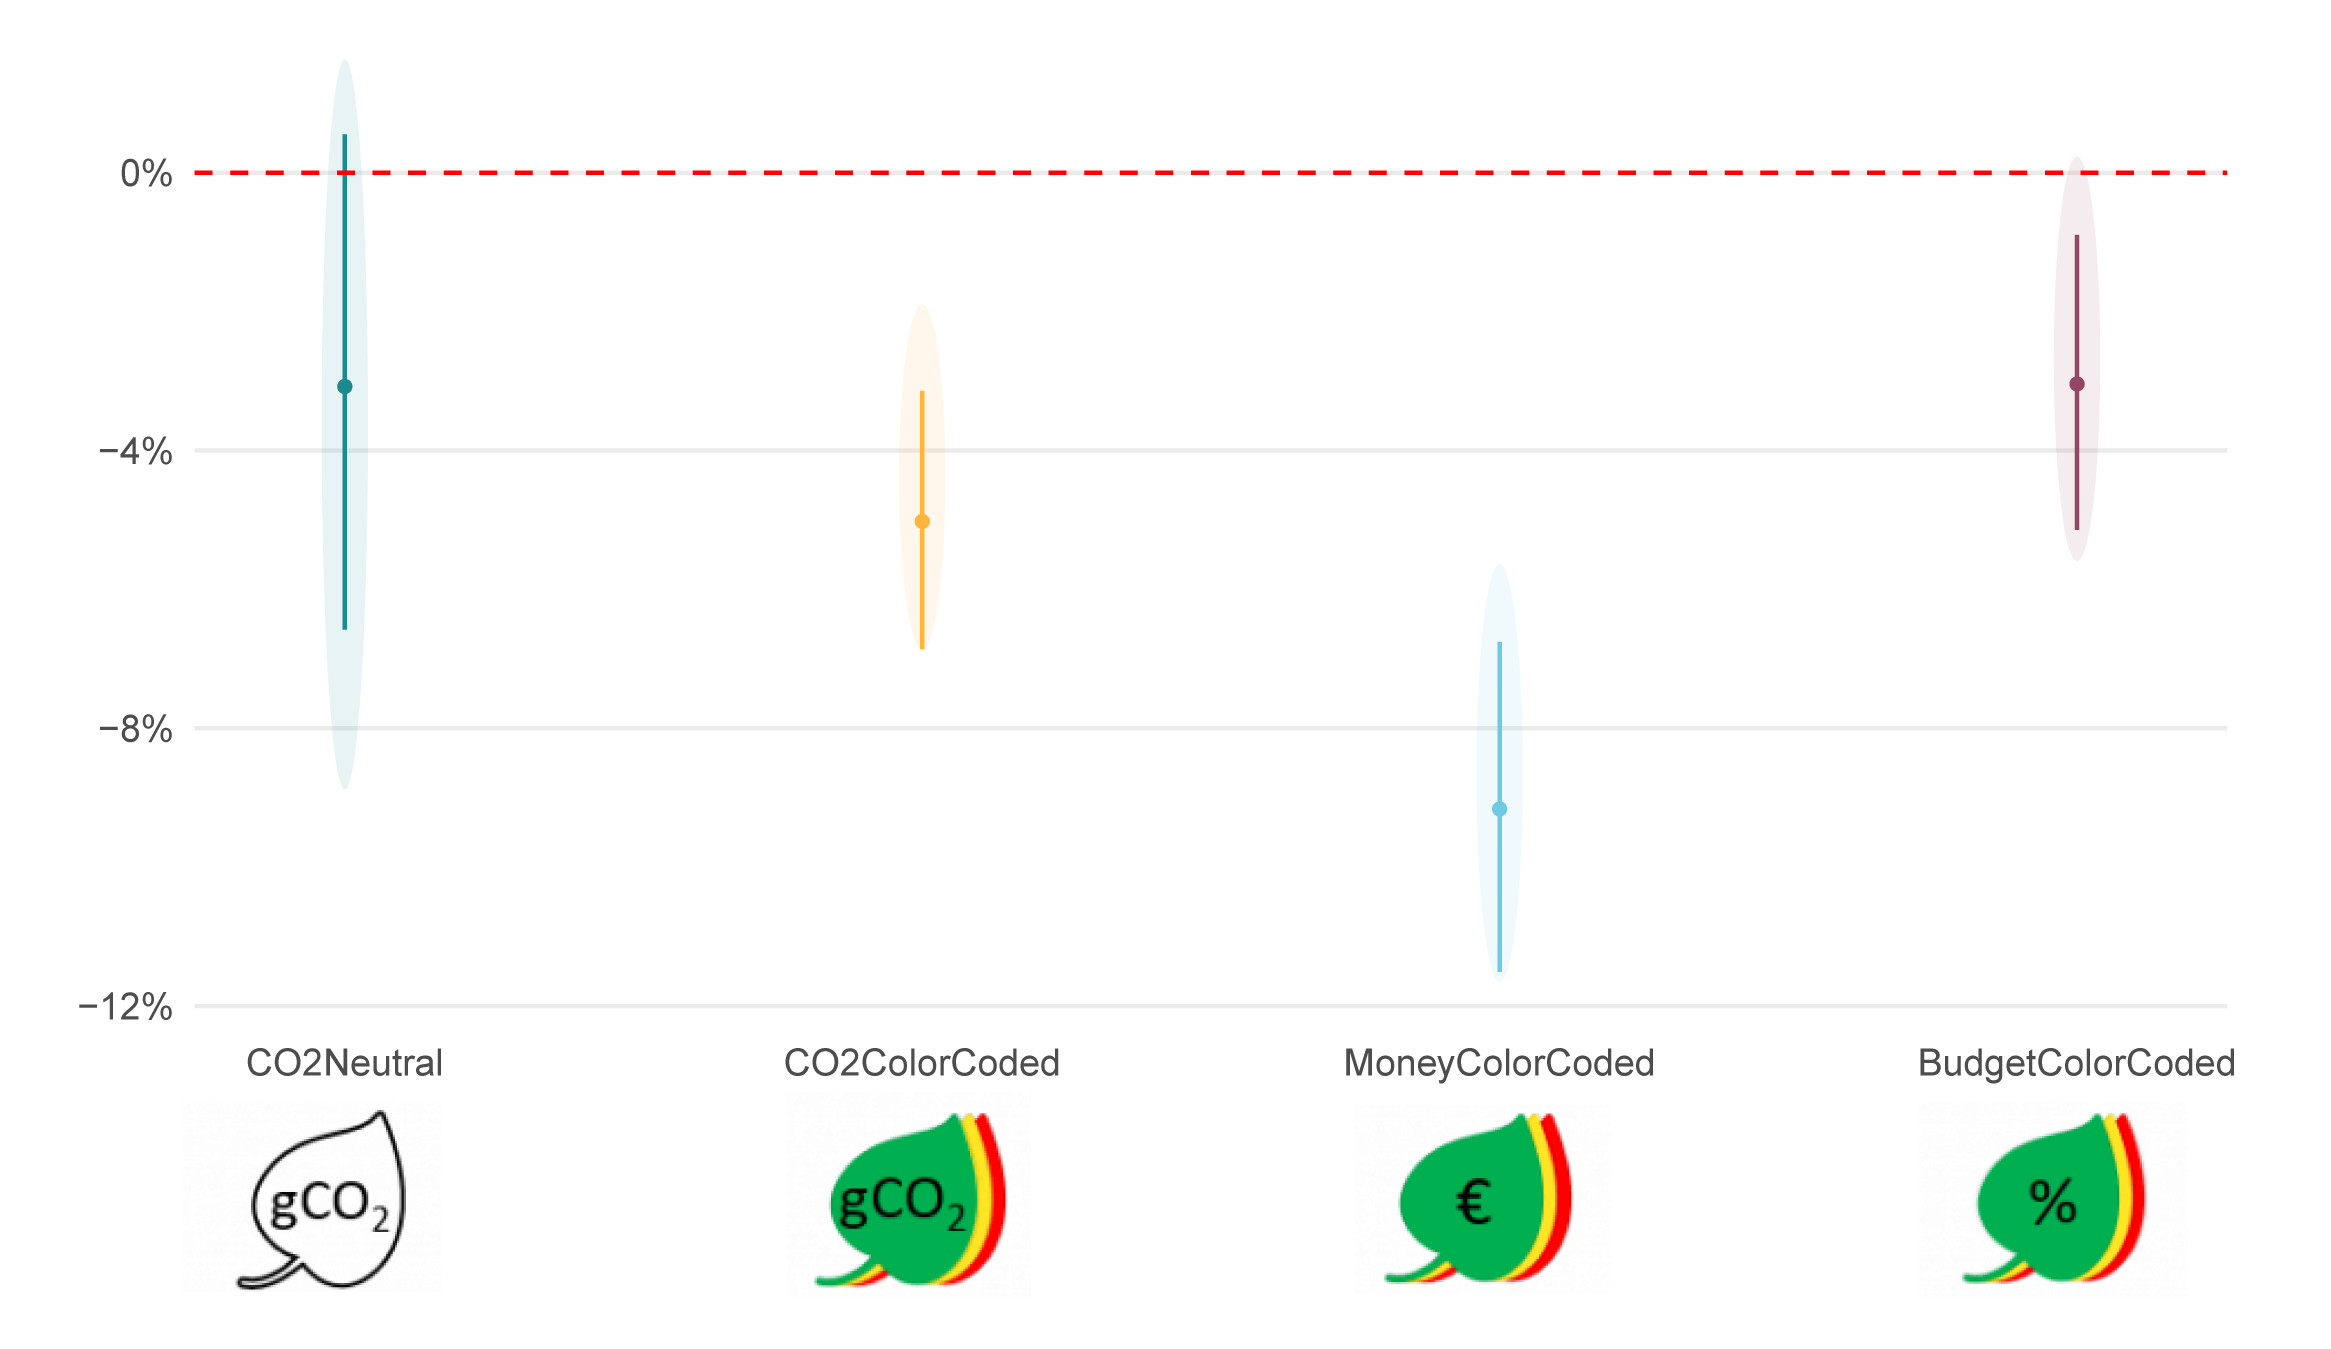
This figure reports our treatment effect estimates based on a sample of 22,713 meal transactions recorded during the 10-day experimental window.
Four CO2 presentation forms (each per 100 grams of the respective food), here indicated by leaf symbols, were used: CO2-equivalent emissions in grams (“g CO2“),
environmental costs in Euros (“€”) and the percentage of a person’s daily CO2 budget for food (“%”). The CO2 figures were presented either in black and white,
or in the signal colours green, yellow or red. Each treatment, indicated on the x axis, was administered for four half days, with a baseline of four additional half
days without any treatment. The effect sizes are measured as percentage changes in the carbon footprint of the chosen main dishes. The ranges reflect 95%
confidence intervals and are based on OLS regression estimates including daily and treatment slot fixed effects. The shaded areas around the confidence
intervals indicate model uncertainty by reflecting the confidence intervals from alternative fixed effects structures.

The experiment in a nutshell
Method
With the help of a field experiment and an accompanying anonymous survey, we investigated the extent to which labeling food with CO2 information influences food choice. Participants were neither pre-selected nor did they know about the ongoing experiment, which was conducted in one of the largest canteens of Studentenwerk München.
Experimental procedures
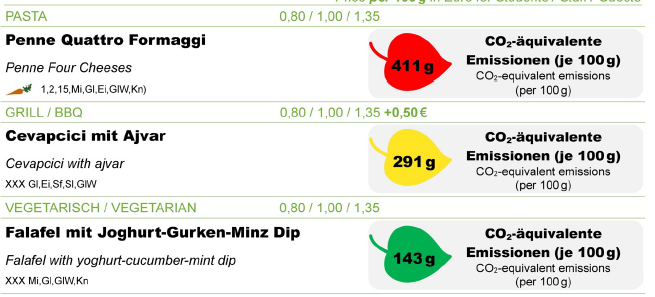
In addition to the usual information on the food offered, the canteen’s display panels showed information on the C02 footprint of the dishes during the experimental period, the display of which varied. The C02 footprint was indicated in different units per 100 grams of the respective dish: in grams of CO2-equivalent emissions, as a percentage of a person’s daily CO2 budget for food, and in environmental costs in Euros. The CO2 data were presented partly in black and white, and partly in the traffic-light colors green, yellow or red. In addition, there were periods without any no CO2 data being presented, to enable observation of consumption behavior absent CO2 information. The C02 footprint of the canteen meals was calculated in advance using data from the KlimaTeller initiative.
Collected data
We measured the effects of CO2 labeling on three variables:
1) the type of dish chosen (meat/fish or vegan/vegetarian)
2) the total amount of the chosen dish in grams, and
3) the carbon footprint of the chosen dish.
The experimental results were complemented by an anonymous survey on, among other things, the satisfaction of the canteen diners and their usual consumption patterns. Are you interested in more information on the experiment method, conditions and data? Please find a detailed description here.
Open Science
Github data and code of the paper are accessible at https://github.com/trr266/carbonfood
Our pre-registered research plan limits the number of ex-post research design choices. But even within these constraints we still faced several decisions, most of which are discussed in our paper. These selected supplementary analyses do not exhaust the set of plausible research design combinations available to us. To address the robustness of our main insights to these choices, while avoiding the prohibitive cost of tabulating and discussing each permutation in detail, we prepared an online dashboard where interested readers can explore a multiverse of up to 61,440 regressions, which combine 12 research design choices that have between 2 and 5 options each.
Our Goal
The experiment helps us understand how the CO2 labeling of food can influence consumer behavior. Of particular interest is which presentation formats of the CO2 information are particularly effective. With this experiment, we want to find out how consumers make their consumption decisions with full knowledge of the associated CO2 emissions. Such informed decision-making, in turn, can contribute to a more sustainable economy and society.
Policymakers
Our study provides policymakers with important information on how to effectively encourage consumers and other stakeholders to behave more sustainably, if that is politically desired.
Business
Our study provides business stakeholders interested in greater transparency with impulses for voluntary CO2 labeling of food and other products and services
Society
Effective measures help us minimize negative environmental, social and economic impacts, accelerating the path to a more sustainable society. Our study offers concrete starting points here.
The different treatments:
During the 10-day trial period, the display format was varied daily as follows:
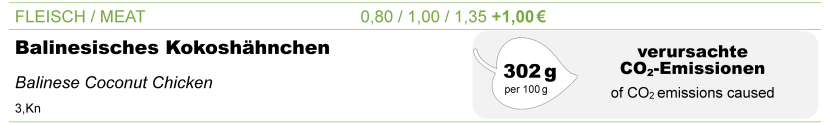
CO2-equivalent emissions in grams
the absolute (‘raw’) number of grams of CO2 equivalent emitted per 100 grams of the dish
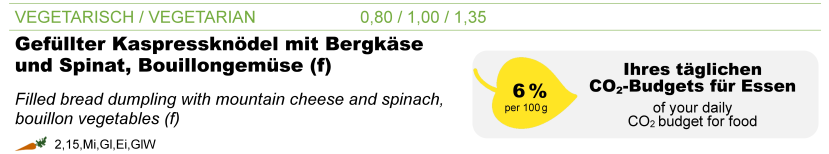
Percentage of a person’s daily CO2 budget for food
the carbon footprint of 100 grams of the respective dish as the relative percentage share of a stylized person’s daily CO2-equivalent emission budget for food
Environmental costs in Euros
the carbon footprint of 100 grams of the respective dish as a Euro estimate of the environmental costs caused
Color coding
the carbon footprint information appears either in a pictorial of a transparent leaf, or in pictorials of leafs in the colors of a traffic light that depend on the carbon footprint (green for low, yellow for medium, or red for high).

Collected data
We measured the effects of CO2 labeling on three variables:
1) the type of dish chosen (meat/fish or vegan/vegetarian)
2) the total amount of the chosen dish in grams, and
3) the carbon footprint of the chosen dish.
The experimental results were supplemented by an anonymous survey on, among other things, the satisfaction of the canteen diners and their usual consumption behavior. Specifically, we asked participants, among other things, how satisfied they were with the meal they chose, whether they ate in a group or alone, and what criteria they usually use to select their food. The voluntary survey was conducted by the Munich Student Union and was linked to an incentive. Participants were entered into a daily draw for a 100-Euro voucher. To participate in the raffle, participants had to enter the number of their cash register receipt. In this way, we were able to link the cash register data on the meal choice with the survey data. It was not possible to identify the participants at any time; participation was completely anonymous.
The sample
The canteen diners were not informed that they were participating in an experiment, so that their meal choices would not be consciously influenced. In total, more than 8,000 individual diners and more than 20,000 meal choices were part of the experiment. More than 700 of the participants participated in the accompanying survey.
Place and period of the experiment
The experiment was conducted on ten working days in November 2022 between 11 a.m. and 2 p.m. each day in a large German canteen at Ludwig-Maximilians-Universität München.
Short interviews
Idea & aim of the study
Prof. Dr. Thorsten Sellhorn (LMU Munich) talks about the idea behind the study and explains how their findings could make a difference.
This was investigated:
Dr. Bianca Beyer (Aalto University, Finland) explains how the team measured the effect of CO2-food-labels on consumers’ consumption behavior with the help of different presentation formats.
How CO2 footprint & color coding were determined:
Simone Euler (HU Berlin) explains in this interview how the team calculated the CO2 footprint of the dishes, and how they determined by which values the dishes were classified as “climate-friendly” or “climate-damaging”. Further, Prof. Dr. Joachim Gassen (HU Berlin) explains why it is so important to conduct a power analysis before conducting the experiment.
This is how the experiment was conducted:
Dr. Ann-Kristin Großkopf (LMU Munich) reports in detail how the experiment was conducted, what were the challenges to overcome, and who supported the team of researchers in their work.
That is why the experiment had to remain a secret:
Dr. Ann-Kristin Großkopf (LMU Munich) and Dr. Bianca Beyer (Aalto University, Finland) explain why the participants of the field study were not supposed to find out that they were taking part in an experiment.
The advantages of “in-principle acceptance”:
Prof. Dr. Joachim Gassen (HU Berlin) and Prof. Dr. Thorsten Sellhorn (LMU Munich) report that the study has already been accepted as a registered report in a renowned journal, and explain why this was so important for the author team, and for conducting the study.
Researchers
The six researchers below from HU Berlin and LMU Munich were involved in this project, which they carried out in cooperation with the Studentenwerk München.