Global MNC Tax Complexity Survey
New regulations, digitalization and global tax competition: Global tax systems are constantly facing new challenges. These developments have a significant impact on how complex tax systems are. In recent years, multinational corporations (MNCs) are dealing with increasing levels of tax complexity, making it an important aspect to consider. Our 2024 Global MNC Tax Complexity survey has once again shown: Tax complexity has increased over the last two years. What does that mean for MNCs? Check our results!
What is Tax Complexity?
We understand tax complexity to be a feature of the tax system that is characterized by two sub-constructs:
Tax code complexity describes the difficulty of reading, understanding and complying with tax regulations that are affected by five complexity drivers. Therefore, we identified 15 internationally comparable tax regulations serving as dimensions for tax code complexity.
Tax framework complexity describes the complexity that arises from the legislative and administrative processes and features within a tax system and is measured in five dimensions.
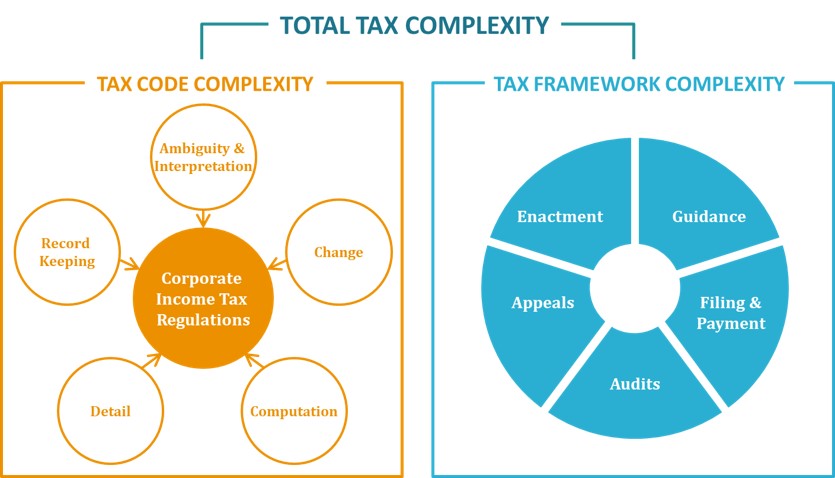
Source: Intertax, Volume 46, Issue 8/9 (2018), p. 668
About the survey
We started the Global MNC Tax Complexity Survey in 2016 and conduct the online study biennially. The aim of our survey is to collect information about the drivers of tax complexity across countries and over time.
Method
In our past surveys we received responses from up to 1,000 tax consultants from up to 110 countries. Our study is conducted through an online survey of local tax consultants around the world who work with MNCs. We share the link to our survey via 16 international tax services networks and firms. Then, we aggregate the individual responses at country level.
Assessment
We asked the respondents for their perceived tax complexity for MNCs in their respective countries on the base of the corporate income tax system applicable in the respective year.
Respondents
Our sample consists of highly skilled tax consultants. The majority occupy leading positions in tax services firms, have worked in the field of taxation for at least a decade, and have a master’s degree or higher. On average, the respondents spend more than 60% of their total working time on MNC tax issues.
You can find detailed information about the Tax Complexity Index in the publication “The Tax Complexity Index – A survey-based country measure of tax code and framework complexity“.
Data Validation
The validation process provides evidence that changes in perceived complexity are often due to specific legal or institutional developments.
The collected data undergoes a rigorous validation procedure. We use a multi-step approach to validate the data and ensure its reliability and high quality.
- For each combination of country and tax regulation, we calculate the change in perceived complexity between the previous and the current survey waves.
- We analyze the bottom and top 5 percentiles of these changes across all country-regulation and country-procedure pairs, in order to identify any specific regulatory or related issues that could account for such strong decreases or increases in perceived complexity.
- We then examine these extreme cases (i.e., the bottom and top 5 percentiles) in greater detail. We categorize deviations according to whether they can be explained (i) completely (due to actual changes in tax law or framework conditionsin the last two years); (ii) partially (with evidence); or (iii) not at all. It is important to note that our study measures perceived complexity. Accordingly, shifts in perception may occur even in the absence of concrete legislative reforms or similar institutional changes, and may reflect changes in our respondents’ sensitivity to tax complexity.
- If changes in perceived complexity cannot be explained, we contact practitioners in the respective countries directly to ask specifically about possible developments in the last two years that might explain the observed change. We also ask them about their own perception of the complexity of this regulation or procedure and whether they agree that it has changed over the past two years.
- Whenever we contact practitioners in a given country due to unexplained changes in the perceived complexity of a regulation or procedure, we also include additional regulations from that country for which the observed changes in the perceived complexity can be at least partially explained, for reference.
- We do not adjust the data in response to any of these validation steps, since we measure perceived complexity. Instead, the validation process lends credibility to our data, indicating that perceived complexity is primarily rooted in genuineregulatory or contextual changes.
2024 Survey Results
Overall Tax Complexity
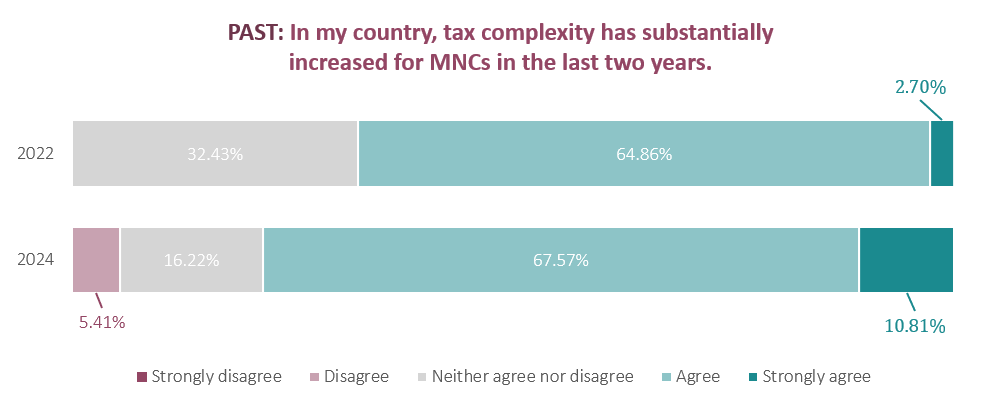
As a first step, participants had to evaluate the relevance of tax complexity in their country in the past, present, and future:
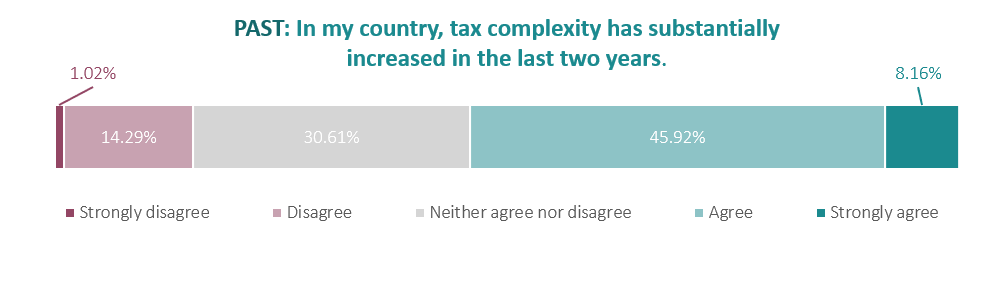
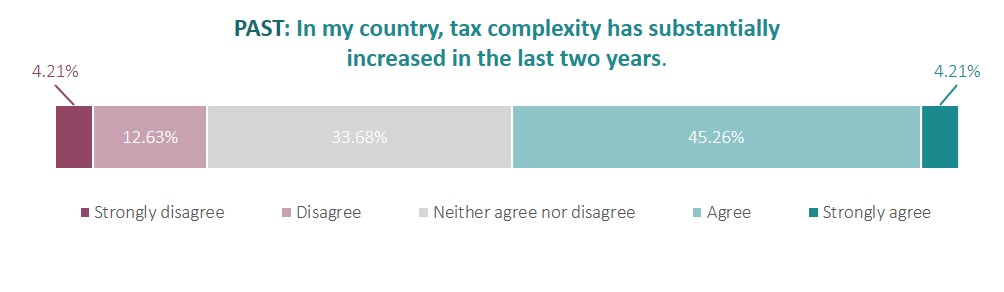
In more than half of the countries (54.08%), respondents, on average, indicate that tax complexity has substantially increased in the last two years. These results highlight the increasing prevalence of tax complexity in many countries.
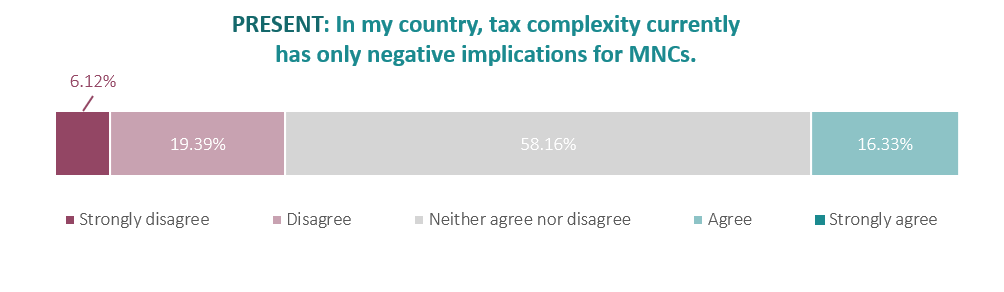
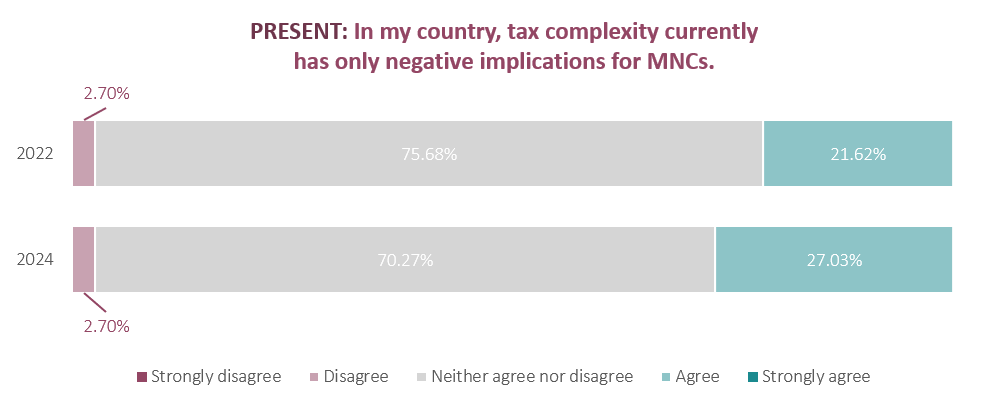
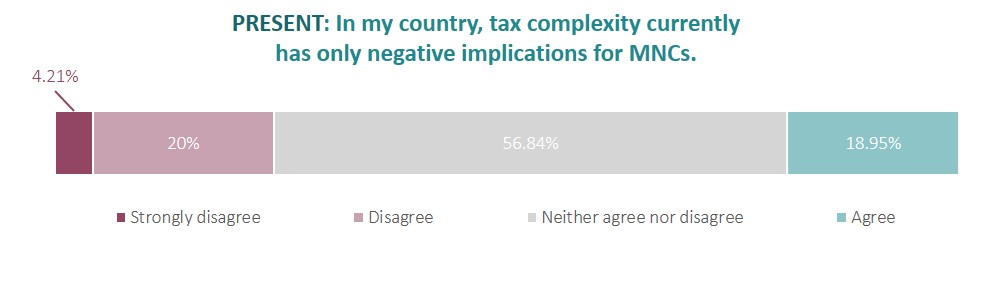
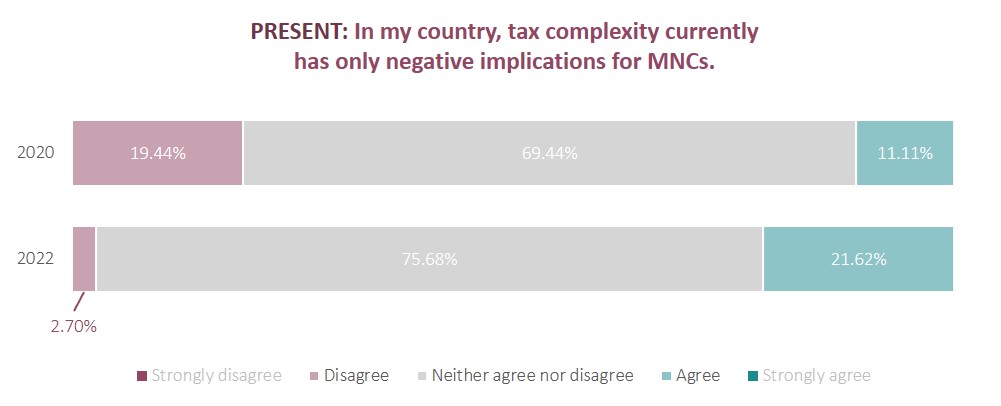
On average, the respondents of most countries do not agree that tax complexity has only negative implications for MNCs. This shows that complexity is not negative per se.
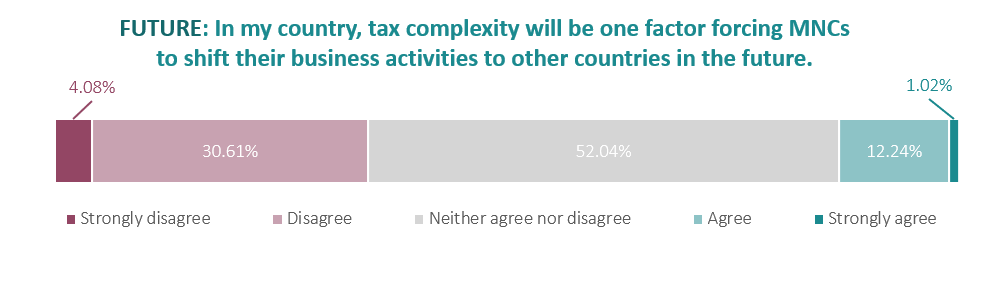
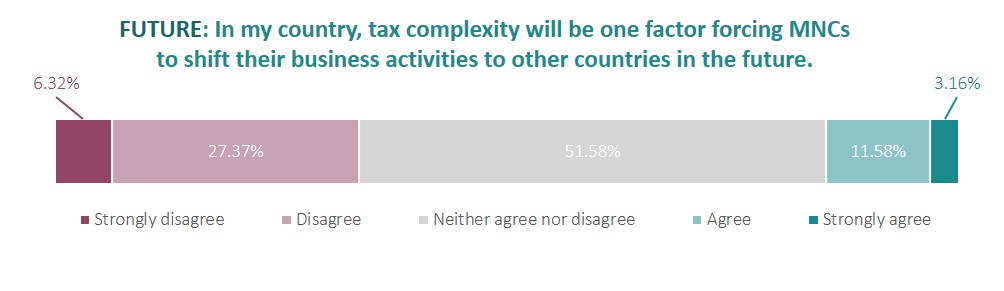
The respondents in the majority of countries, on average, do not agree with the statement that tax complexity will force MNCs to shift their business activities to other countries. However, respondents in over 13% of the countries do, on average, agree with this statement. Despite the relatively small number of countries, it still implies a call for action for policy makers to reduce tax complexity.
Individual responses are aggregated at country level. If the resulting country-level aggregate of responses lies between two response categories, it is attributed to the nearest category.
Tax Code Complexity
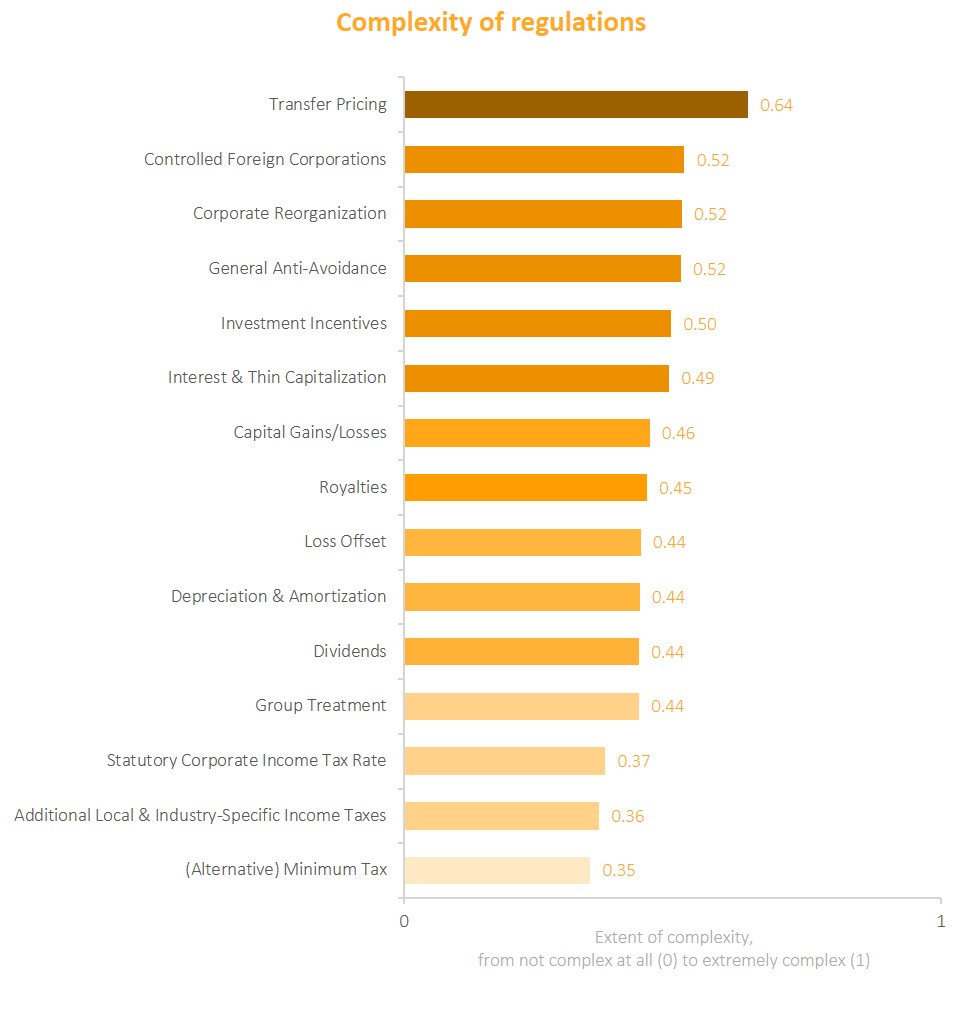
Transfer pricing is perceived as the most complex regulation
Of the 15 tax regulations examined, transfer pricing is once again perceived as the most complex: for 60 of 98 countries, it was ranked as most complex. This likely reflects factors such as extensive documentation requirements, growing substance demands and increasing differences in national interpretation, which may result in legal uncertainty and rising levels of controversy. Regulations concerning corporate reorganization and general anti-avoidance follow in second and third place, respectively, in terms of perceived complexity. These three most complex regulations show that efforts to regulate tax avoidance and structural corporate changes often result in significant complexity for MNCs, especially in a global environment marked by regulatory fragmentation and increasing enforcement.
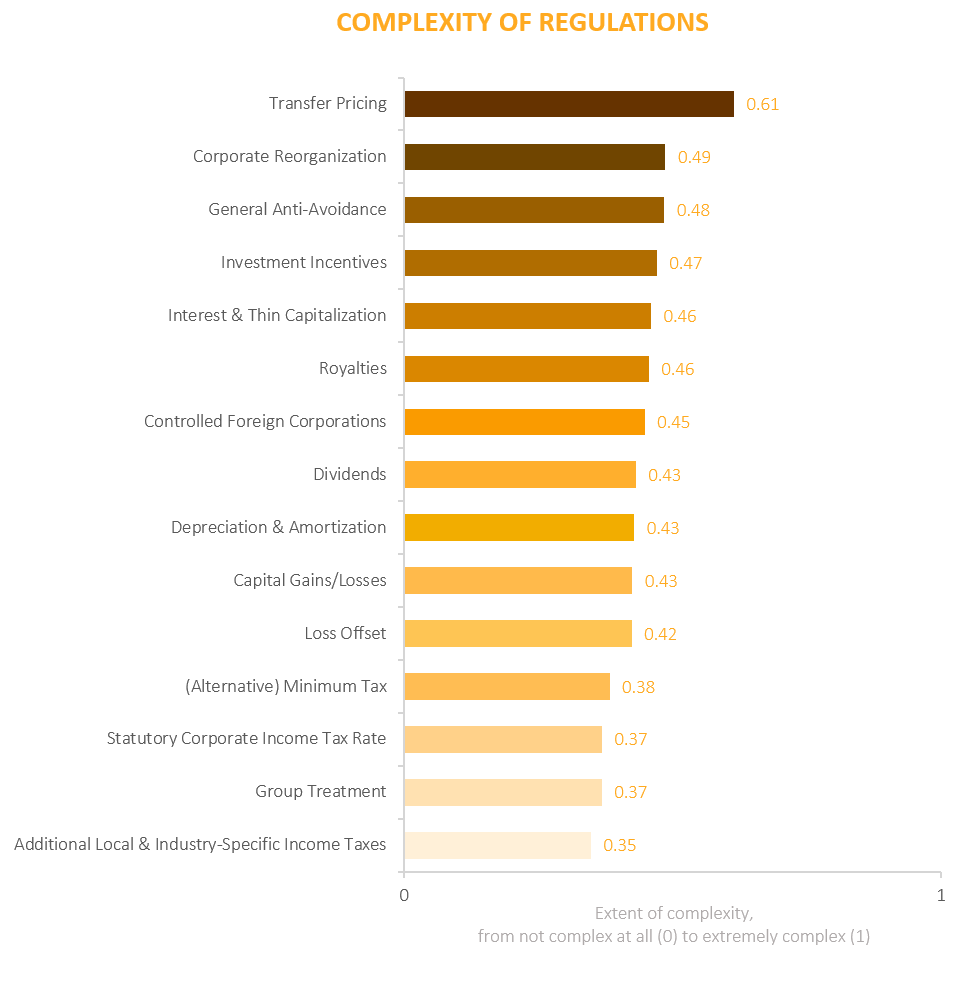
Individual responses are aggregated at country level. The analysis only includes countries in which the respective regulation is considered existent.
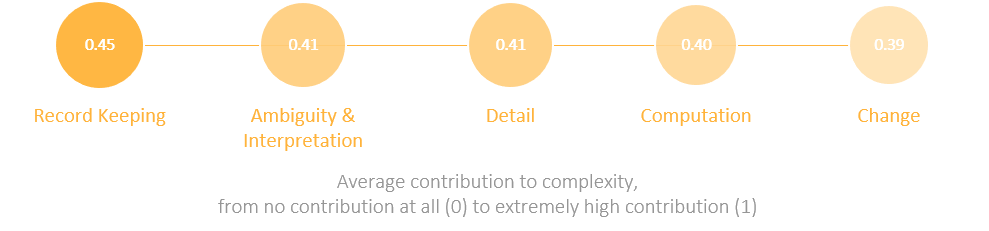
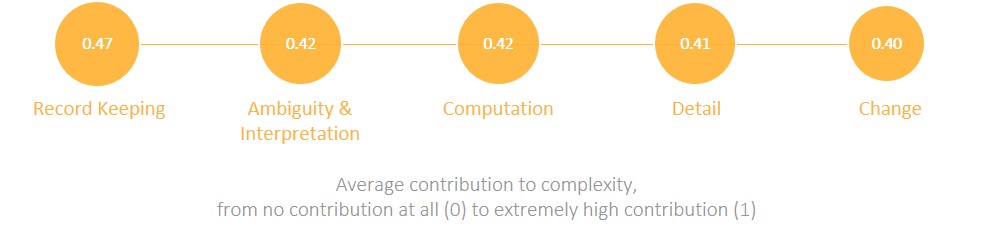
Record keeping contributes most to complex tax regulations
On average, record keeping is perceived as the driver which contributes most to the complexity of tax regulations. Hence, keeping many records and documents to substantiate tax claims or to complete tax returns seems to be the greatest challenge in the application of tax regulations.
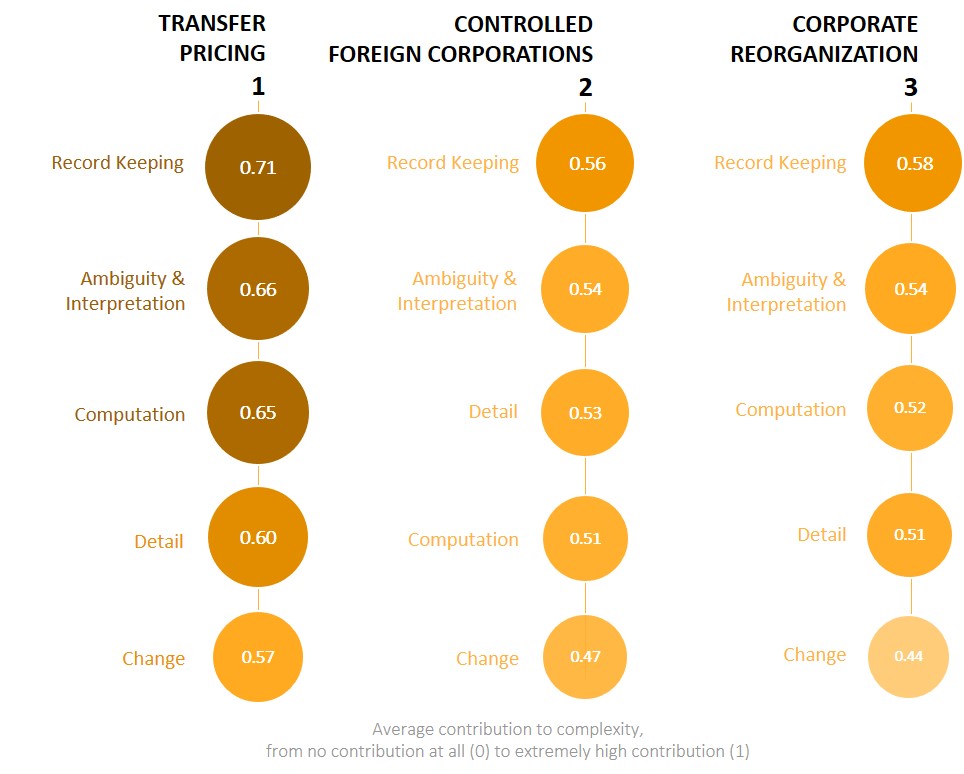
However, individual regulations may be affected differently by the drivers of tax complexity, as illustrated by a closer look at the three most complex regulations: The main driver of the complexity of regulations on transfer pricing and corporate reorganization is record keeping. The complexity of those regulations is least driven by change. In contrast, the complexity of general anti-avoidance regulations is primarily driven by ambiguity and interpretation, whereas computation contributes the least to its perceived complexity.
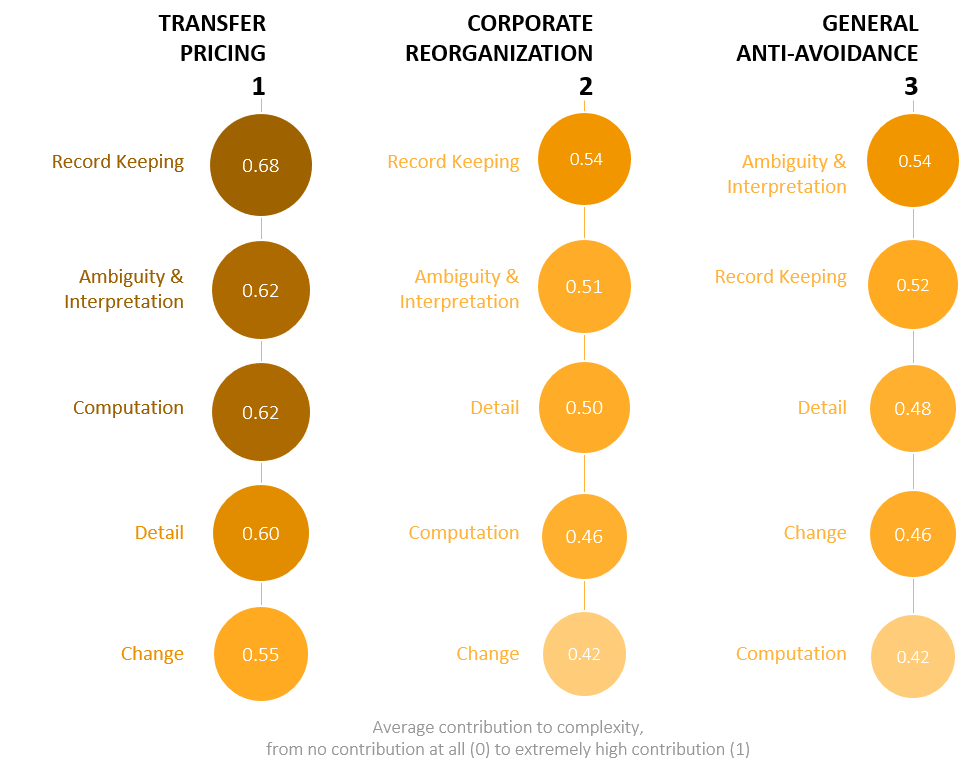
Individual responses are aggregated at country level. The analysis only includes countries in which the respective regulation is considered existent.
Tax Framework Complexity
Tax Audits
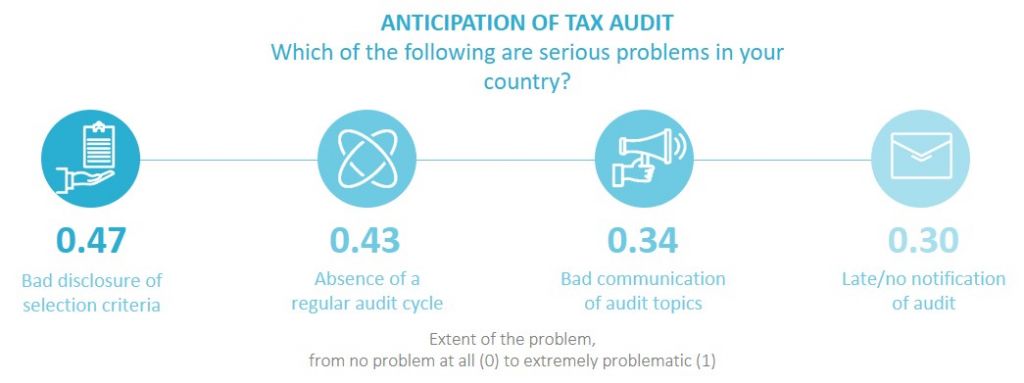
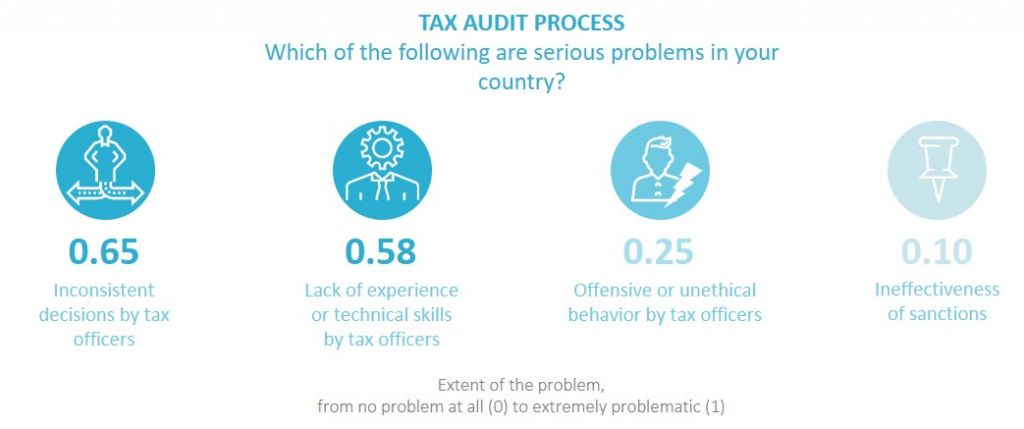
Tax audits describe the examination of the tax returns by the tax authority as well as the extent to which they can be anticipated and prepared.
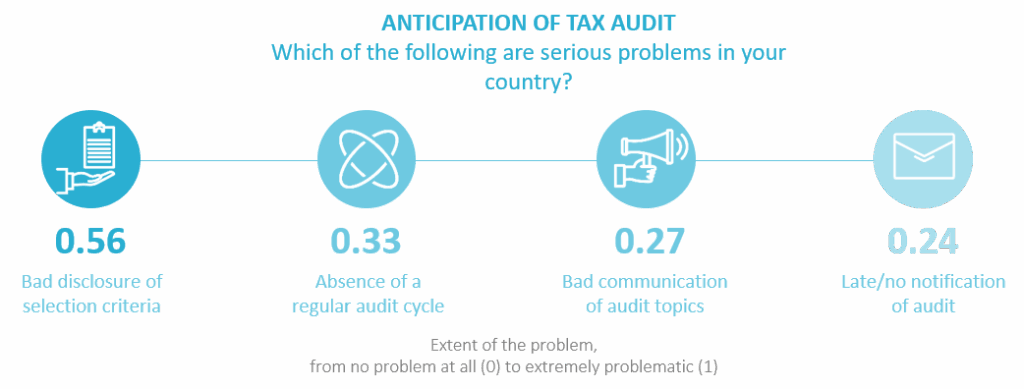
In 79 of 98 countries, lacking or only limited disclosure of selection criteria for tax audit targets is, on average, perceived as the most serious problem in the anticipation of tax audits. This lack of transparency in selection criteria seems to challenge MNCs.
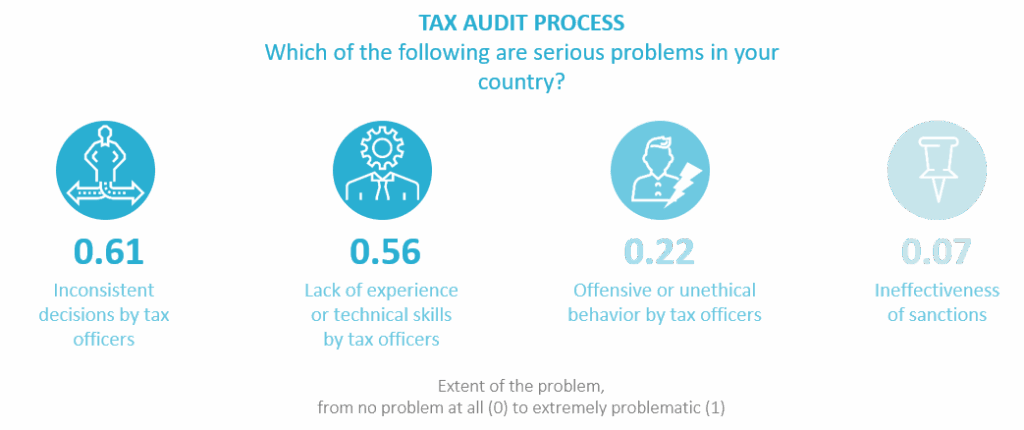
Rules or written guidelines that clearly outline the tax audit process exist in 73 of 98 countries. Even though this suggests uniformity in the performance of tax officers, in 71 of 98 countries the inconsistency of tax officers’ decisions is perceived as the most serious problem in the tax audit process. This discrepancy may exist because tax audit guidelines often leave discretion to tax officers, leading to inconsistent decisions on similar cases from officer to officer, and even within the same officer.
Individual responses are aggregated at country level.
Influence of Digital Technologies in 2024
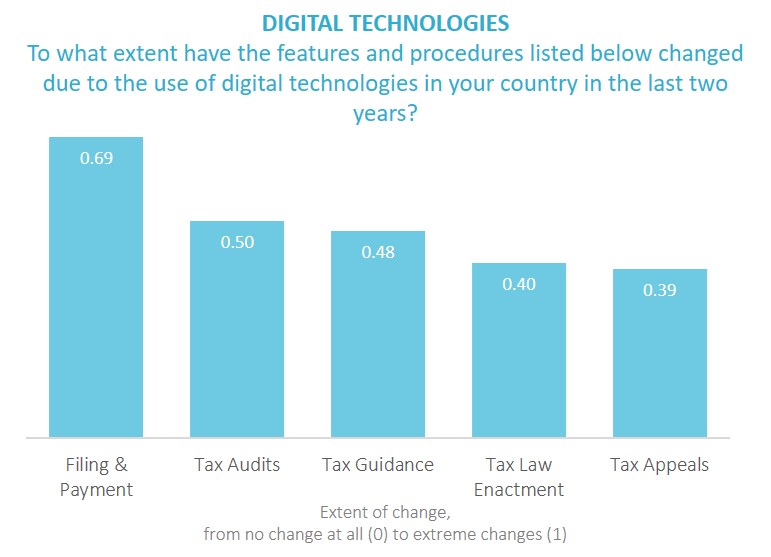
Digitalization is fundamentally reshaping many legislative and administrative processes world-wide. However, not all processes are affected in the same way. Since 2020, our survey has included a question assessing the extent to which digital technologies have changed the different processes and features of the tax framework.
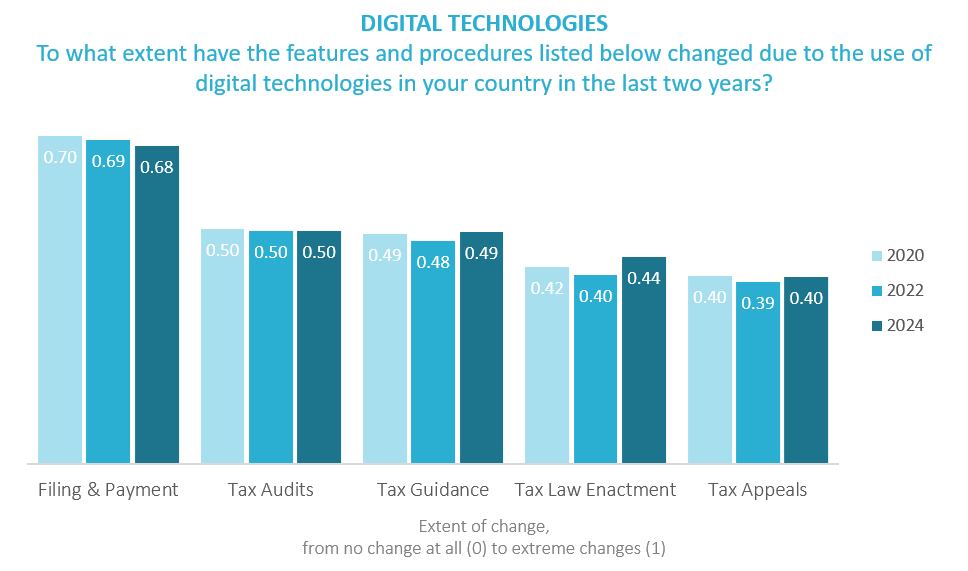
In 94 out of 98 countries, filing and payment is perceived to have changed the most due to the use of digital technologies in the last two years. For example, both the remittance of tax payments and the transmission of tax returns are rather standardized procedures in which digital technologies can be introduced comparatively easily. Although filing and payment remains the leading area of digital transformation, the pace of change has slowed slightly in recent years.
Other areas such as tax audits, guidance and appeals have seen little development over time, whereas tax law enactment shows a modest upward trend. Digital transformation in tax appeals continues to lag behind, indicating persistent challenges in enabling digital access to dispute resolution.
Individual responses are aggregated at country level.
OECD Countries in 2022 and 2024
The OECD is one of the main players in the international tax environment. In the following section, we therefore present the major changes in tax complexity observed in 2024 as compared to our 2022 Global MNC Tax Complexity Survey for the OECD member countries. The 38 member countries are among the world’s most developed economies and almost exclusively represent high-income countries.
In 2024, respondents in the vast majority of OECD countries, on average, agree or strongly agree with the statement that tax complexity has substantially increased within the last two years. Respondents in 78.38% of the OECD member countries agree or strongly agree to the statement above in 2024, which is an increase compared to the 2022’s share of respondents (67.56%). In two OECD country (namely, Estonia and Latvia) respondents, on average, disagree with the statement that tax complexity has substantially increased for MNCs in the last two years in 2024. This marks a slight increase compared to 2022, when respondents in 0% of OECD member countries disagreed.
On average, respondents in most OECD countries do not agree that tax complexity has only negative implications for MNCs. This shows that complexity is not negative per se.
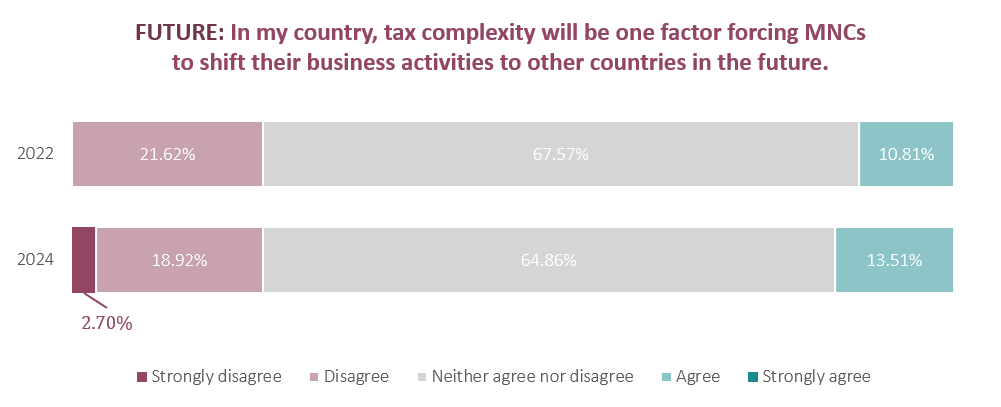
Our results indicate that respondents in more OECD member countries, on average, agree that tax complexity has substantially increased in the last two years (see Page 17). In addition, we observe that tax complexity has an increasing impact on MNCs’ business location decisions. The share of respondents in OECD countries who disagreed with the statement that tax complexity will drive MNCs to relocate remained unchanged between 2022 and 2024. In contrast, respondents in 13.51% of OECD countries, on average, agree with the statement that tax complexity is a factor driving MNCs to relocate their business activities (vs. 10.81% in 2022).
Individual responses are aggregated at country level. If the country response lies between two response categories, it is attributed to the nearest category.
The OECD countries are: Australia, Austria, Belgium, Canada, Chile, Colombia, Costa Rica*, Czech Republic, Denmark, Estonia, Finland, France, Germany, Greece, Hungary, Iceland*, Ireland, Israel, Italy, Japan, Korea (South), Latvia, Lithuania, Luxembourg, Mexico, Netherlands, New Zealand, Norway, Poland, Portugal, Slovakia, Slovenia, Spain, Sweden, Switzerland, Turkey, United Kingdom, United States.
*Please note that in the subsequent analysis, Iceland is not included in the sample for lack of data. Also, Costa Rica has only become an OECD member in 2021 and is therefore not included in the 2020 dataset. This leaves us with a sample of 36 OECD countries in 2020 and 37 OECD countries in 2022.
Data Validation 2024
For 2024, we examined 125 changes in accordance with the data validation procedure and found that 86% of these extreme changes can indeed be explained by regulatory changes.
Results from past surveys
Here you can find the detailed results of our past surveys.
Overall Tax Complexity
As a first step, participants had to evaluate the relevance of tax complexity in their country in the past, present, and future:
In less than half of the countries (49.47%), respondents, on average, indicate that tax complexity has substantially increased in the last two years.
On average, the respondents of most countries do not agree that tax complexity has only negative implications for MNCs. This shows that complexity is not negative per se.
The respondents in the majority of countries, on average, do not agree with the statement that tax complexity will force MNCs to shift their business activities to other countries. However, respondents in almost 15% of the countries do, on average, agree with this statement. Although this finding seems to be somewhat ambiguous, it still implies a call for action for policy makers to reduce tax complexity.
Individual responses are aggregated at country level. If the resulting country-level aggregate of responses lies between two response categories, it is attributed to the nearest category.
Tax Code Complexity
Transfer pricing is perceived as the most complex tax regulation
Of the 15 tax regulations examined, transfer pricing is perceived as the most complex: for 65 of 95 countries, it was ranked as most complex. This is in line with transfer pricing being one of the main concerns of the OECD’s BEPS project. Moreover, it is currently one of the core features of the OECD’s Pillar 1, which shall serve to fight tax avoidance and enhance the fair allocation of tax revenues across countries. However, Pillar 1 also has the potential to further increase tax complexity of transfer pricing. The aim of tackling tax avoidance also applies to general anti-avoidance regulations as well as to controlled foreign corporation rules, which, together with transfer pricing, are among the most complex regulations.
Individual responses are aggregated at country level. The analysis only includes countries in which the respective regulation is considered existent.
Record keeping contributes most to complex tax regulations
On average, record keeping is perceived as the driver which contributes most to the complexity of tax regulations. Hence, keeping many records and documents to substantiate tax claims or to complete tax returns seems to be the greatest challenge in the application of tax regulations.
However, individual regulations may be affected differently by the drivers of tax complexity, which is outlined by a closer look at the three most complex regulations: The main driver of the complexity of regulations on transfer pricing, controlled foreign corporations and corporate reorganization is record keeping. The complexity of those regulations is least driven by change.
Individual responses are aggregated at country level. Individual responses are aggregated at country level. The analysis only includes countries in which the respective regulation is considered existent.
Tax Framework Complexity
Tax Audits
Tax audits describe the examination of the tax returns by the tax authority as well as the extent to which they can be anticipated and prepared by MNCs.
In 60 of 95 countries, lacking or only limited disclosure of selection criteria for tax audit targets is, on average, perceived as the most serious problem in the anticipation of tax audits. This lack of transparency in selection criteria seems to challenge MNCs.
Rules or written guidelines that clearly outline the tax audit process exist in about three quarters of countries. Even though this suggests uniformity in the performance of tax officers, in 70 of 95 countries the inconsistency of tax officers’ decisions is perceived as the most serious problem in the tax audit process. This contrast may exist because tax audit guidelines often leave discretion to tax officers, which leads to varying decisions on similar cases from officer to officer or even inconsistency with the same officer.
Individual responses are aggregated at country level.
Influence of Digital Technologies in 2022
Digitalization is fundamentally reshaping many legislative and administrative processes world-wide. Nevertheless, not all processes are affected in the same way. Therefore, we included a new question in our 2020 and 2022 survey about the extent to which digital technologies have changed the different processes and feature of the tax framework.
In 77 of 95 countries, filing and payment has changed the most due to the use of digital technologies in the last two years. For example, both the remittance of tax payments and the transmission of tax returns are rather standardized procedures in which digital technologies can be introduced comparably easily.
The dimension of the tax framework least affected by digital technologies is appeals. Despite efforts by the OECD to make appeals, and more specifically MAPs, more efficient, the high level of perceived complexity of appeals indicates that there is still room for improvement in the digital access to appeal procedures.
Individual responses are aggregated at country level.
OECD Countries in 2020 and 2022
The Organisation for Economic Co-operation and Development (OECD) is one of the main players in the international tax environment. In the following section, we therefore present the major changes in tax complexity in 2022 as compared to our 2020 Global MNC Tax Complexity Survey for the OECD member countries. The 38 member countries are among the most developed countries worldwide and almost exclusively represent high-income economies.
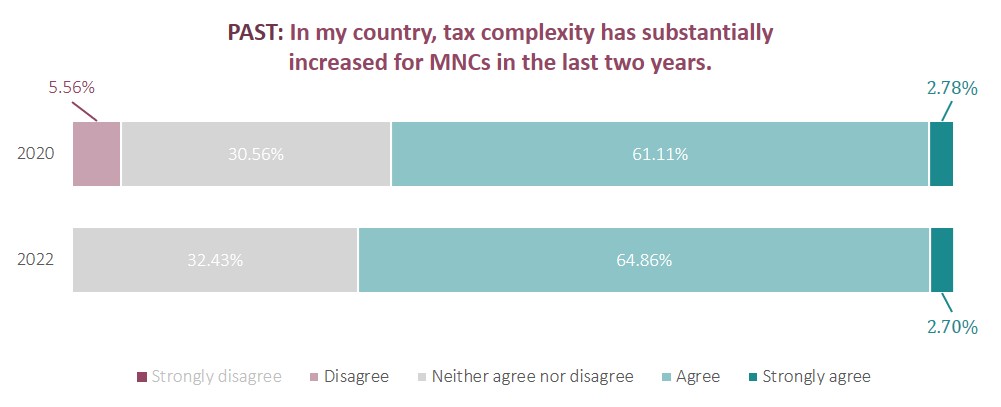
In 2022, respondents in the vast majority of OECD countries, on average, agree or strongly agree with the statement that tax complexity has substantially increased within the last two years. This majority of 67.56% of respondents who agree or strongly agree to the statement above in 2022 is almost identical to the 2020’s share of respondents (63.89%). In no OECD country respondents disagree with the statement that tax complexity has substantially increased for MNCs in the last two years in 2022. This constitutes a decrease compared to 2020 (5.56%).
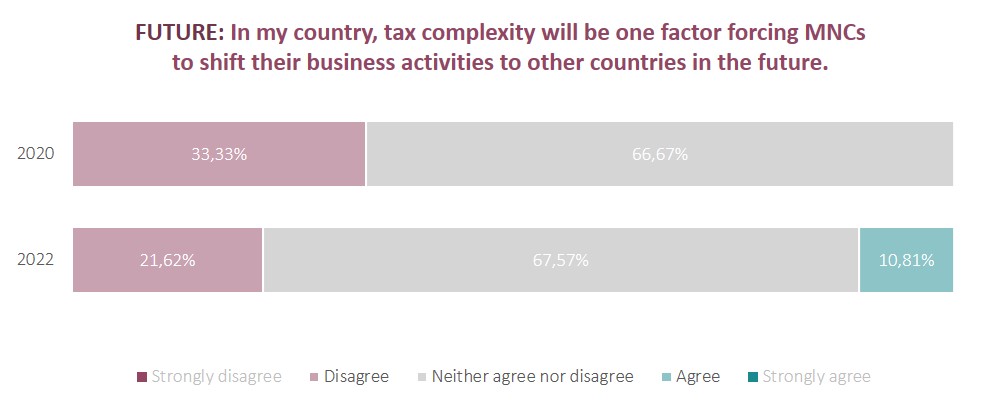
Our results indicate that respondents in more OECD countries, on average, agree that tax complexity has substantially increased in the last two years (see above). In addition, we observe that tax complexity has an increasing impact on MNCs’ business location decisions. Respondents in OECD countries in 2022, on average, disagree less (11.71 percentage points) with the statement that tax complexity will be one factor forcing MNCs to relocate their business activities to other countries. In fact, 10.81% of respondents from an OECD country agree with the statement that tax complexity is a factor driving MNCs to relocate their business activities (vs. 0% in 2020).
Individual responses are aggregated at country level. If the country response lies between two response categories, it is attributed to the nearest category.
The OECD countries are: Australia, Austria, Belgium, Canada, Chile, Colombia, Costa Rica*, Czech Republic, Denmark, Estonia, Finland, France, Germany, Greece, Hungary, Iceland*, Ireland, Israel, Italy, Japan, Korea (South), Latvia, Lithuania, Luxembourg, Mexico, Netherlands, New Zealand, Norway, Poland, Portugal, Slovakia, Slovenia, Spain, Sweden, Switzerland, Turkey, United Kingdom, United States.
*Please note that in the subsequent analysis, Iceland is not included in the sample for lack of data. Also, Costa Rica has only become an OECD member in 2021 and is therefore not included in the 2020 dataset. This leaves us with a sample of 36 OECD countries in 2020 and 37 OECD countries in 2022.
Why do our results matter?
In recent years, MNCs have faced increasing levels of tax complexity, making it an important aspect to consider. We suppose this development is shaped by, among other things, multiple trends in global tax systems, each of them with potentially ambivalent effects on tax complexity. We analyze the level and change of tax complexity in and across countries and over time. We also measure what drives tax complexity. Our data and analyses provide a unique basis for future studies on the role of tax complexity for compliance and firms’ investment decisions.
Our results are particularly interesting for policymakers, practitioners and researchers. With our data and our analyses, we want to enhance the understanding of tax complexity in and across countries.
Tax Complexity Website
Based on our survey results, we construct the Tax Complexity Index that measures countries’ tax complexity in several dimensions. We include those countries for which we obtained sufficient responses to qualify for the index. For methodological details, see Hoppe, Schanz, Sturm, and Sureth-Sloane (2023).
Data for the 2016, 2018, 2020, 2022 and 2024 Tax Complexity Index is available through our interactive website. This website allows you to learn more about tax complexity and facilitate comparative analyses of different countries over time. Additionally, our website enables you to create your own index based on your specific interests and priorities in various dimensions of the tax code and the tax framework.
We are and have been dedicated to the philosophy of open science from the very beginning of our Global MNC Tax Complexity Survey. The website allows you to learn more about tax complexity in many countries, to compare countries and track the development of tax complexity over time. It also offers you plenty of possibilities to make your own index.
We also very much appreciate any feedback and you are welcome to share the website with any interested parties.
Acknowledgements
We thank the following participants for supporting us and taking part in the 2024 Global MNC Tax Complexity Survey!
The researchers
The following researchers from LMU Munich and Paderborn University were involved in establishing and conducting the 2024 survey and analyzing the data.
Kristin Gerdes
LMU Munich
PhD Student
A05
Simon Harst
LMU Munich
PhD Student
Data validation
Related Publications
Determinants of Tax Complexity – Evidence from a Developing Country
Anti-Tax Avoidance Rules and Tax Complexity
No. 201: Tax Complexity and Firm Value
2024 Global Tax Complexity Survey
No. 151: Determinants of Tax Complexity in Tax Regulations and Tax Procedures – Evidence from a Developing Country
No. 149: Where to Locate Tax Employees? The Role of Tax Complexity and Tax Risk Implications
Komplexität von Verrechnungspreisen und Tax Compliance: Einblicke in deutsche Unternehmen
No. 153: The Downsides of Democracy? The Case of Tax Complexity
No. 152: Too Complex to Cooperate? Tax Complexity and Cooperative Compliance
2022 Global MNC Tax Complexity Survey
The Tax Complexity Index – A survey-based country measure of tax code and framework complexity
2020 Global MNC Tax Complexity Survey
No. 5: The Tax Complexity Index – A survey-based country measure of tax code and framework complexity
2018 Global MNC Tax Complexity Survey
No. 20: Tax complexity in Canada: A comparative perspective
Tax complexity in Australia – A survey-based comparison to the OECD average
No. 13: The relation between tax complexity and foreign direct investments: Evidence across countries
Tax complexity for multinational corporations in South Africa – Evidence from a global survey
Steuerkomplexität im Vergleich zwischen Deutschland und Österreich – Eine Analyse des Status quo
Related Blog Posts
Simplification of the global minimum tax: a simple yet viable solution
The introduction of the global minimum tax (GloBE, also known as Pillar Two) leads to criticism by affected firms. The solution: firms should be exempted from filing a GloBE declaration for those countries where it is likely that they easily meet the agreed minimum tax rate via.
Read moreThe Tax Complexity Index – An innovative measure to analyze tax complexity across countries
Recently, the relevance of tax complexity has increased significantly. This is a potential threat for the economy and society since the negative consequences of complex tax systems can jeopardize economic prosperity and encourage undesired tax planning as well as tax avoidance.
Read moreComparing Tax Complexity: Germany vs. Austria
An infographic summarizes the main differences and similarities in tax complexity between Germany and Austria.
Read moreRelated News
Concept & Editorial Lead
Wanda Feldkamp
LMU Munich
Science Communication Officer
C03